
Menu Engineering in the Data Age: How Smart Operators Use Analytics to Build Menus That Maximise Profit
Learn how menu engineering helps restaurants boost profits by analysing dish popularity and margins. Discover the four quadrants, key metrics, and how tools like Tenzo and MarketMan turn data into smarter menu decisions.
Your menu is the single most powerful revenue tool your restaurant has. Every item on it either earns its place or costs you money. Yet most operators set their menus based on intuition, chef preference, or what sold well last s1eason - and then wonder why margins are squeezed even when the dining room is full.
Menu engineering changes that. It's a structured, data-driven approach to analysing and optimising your menu so every dish is working as hard as it can for your bottom line. And in 2026, with rising food costs, tighter labour budgets, and guests who expect value, it's no longer a 'nice to have' — it's a competitive necessity.
In this guide, we'll walk you through exactly how menu engineering works, how to classify your dishes using real data, and how platforms like Tenzo and MarketMan give restaurant operators the analytics firepower to do this at scale, and keep doing it as your business evolves.
Rechner für Restaurant-Kennzahlen
Erschließen Sie wichtige Restaurant-Leistungskennzahlen, um die betriebliche Effizienz, Rentabilität und das Wachstum durch messbare Erkenntnisse zu steigern.

What Is Menu Engineering — and Why Does It Matter?
Menu engineering is the practice of analysing every item on your menu through two lenses: profitability (how much gross profit does this dish contribute?) and popularity (how often do guests order it?). The concept was first formalised by Michael Kasavana and Donald Smith at Michigan State University in the 1980s, but the real power of the method has only become accessible to everyday restaurant operators in the last few years, thanks to data.
At its core, menu engineering answers three questions:
- Which dishes are making you the most money per cover?
- Which dishes are flying out of the kitchen but barely covering their ingredient costs?
- Which dishes are dragging down both your GP and your kitchen's efficiency?
Once you can answer those questions with confidence backed by real sales data and up-to-date food costs — you can make menu decisions that compound over time. Small adjustments to pricing, positioning, or portion size can add up to significant gains across hundreds of covers a week.
Industry insight: Research consistently shows that a well-engineered menu can increase gross profit by 10–15% without adding a single new customer. The opportunity is already sitting in your existing menu.
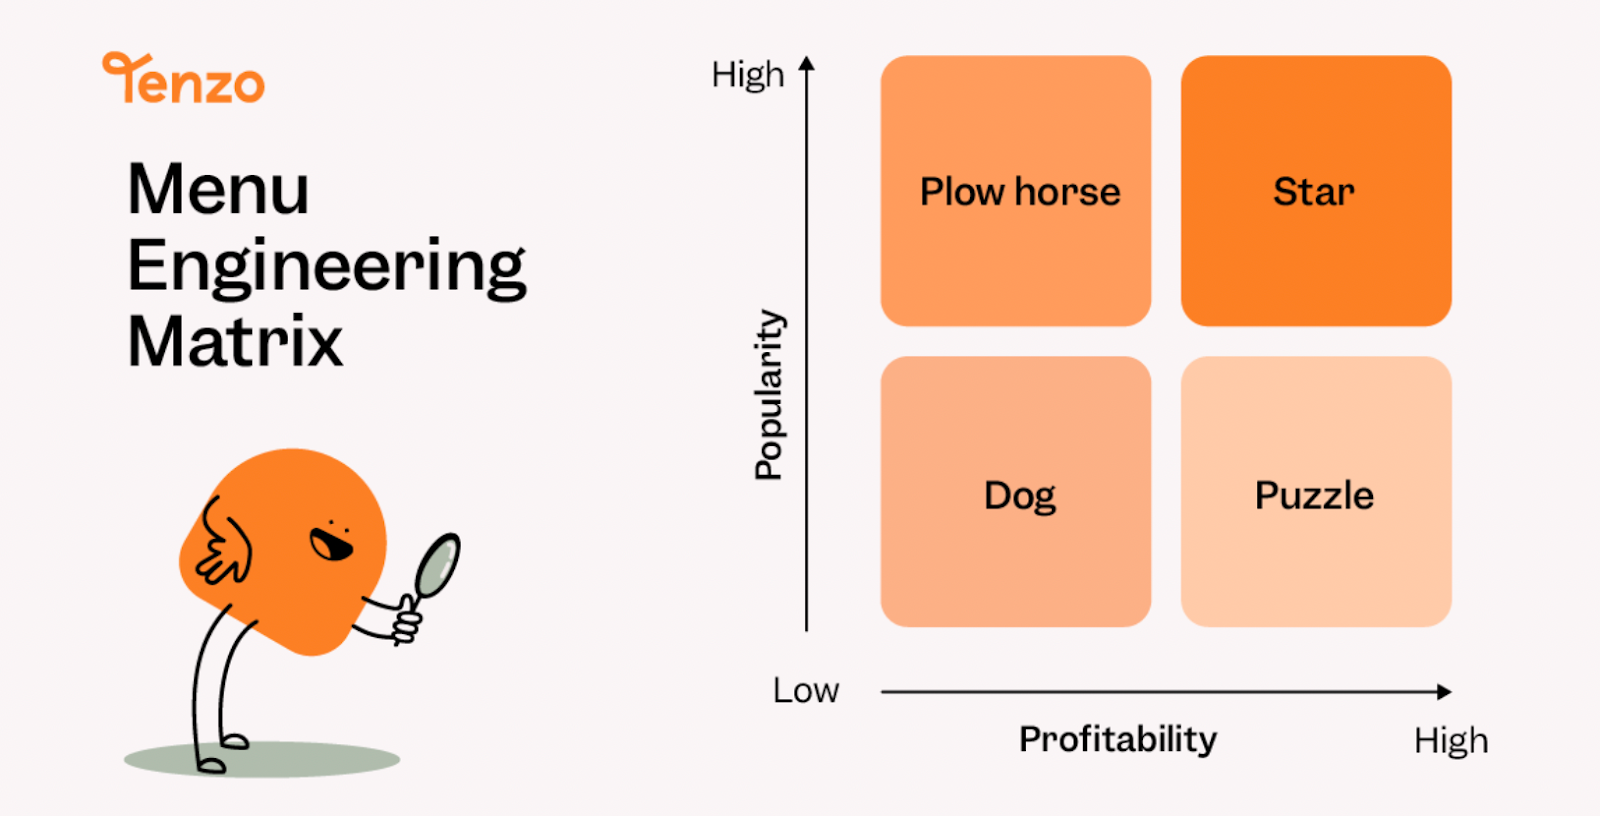
The Four Quadrants: A Framework Every Operator Needs to Know
Menu engineering classifies every dish into one of four categories, based on where it sits on the profitability vs. popularity matrix.
⭐ Stars — High Margin, High Popularity Stars are your profit engines. Guests love them and they contribute the most to your bottom line. Protect them: keep food costs controlled (monitor ingredient price changes in MarketMan), keep them prominent on the menu, and train your front-of-house team to talk them up.
🐎 Plowhorses — Low Margin, High Popularity Ordered frequently, but their food cost is eating into your GP. You don't want to axe them — guests like them — but you need to engineer them. Options include a subtle price increase, a slight portion adjustment, substituting a high-cost ingredient, or bundling with a higher-margin add-on.
❓ Puzzles — High Margin, Low Popularity Hidden gems. They'd be Stars if more people ordered them — so ask why they aren't. Is it the name? The description? The position on the menu? A rewritten dish description or a move to a more prominent position can be enough to turn a Puzzle into a Star.
🐶 Dogs — Low Margin, Low Popularity Dogs don't earn their menu real estate. The right call is usually to remove them — though occasionally a refresh (different protein, new preparation, updated name) can give one a second chance.
The Data You Need — and Where It Comes From
Effective menu engineering is only as good as the data behind it. To classify your dishes accurately, you need two things working together: real-time sales data and accurate, up-to-date food costs. This is where the combination of Tenzo and MarketMan becomes genuinely powerful.
Sales Data: Understanding What Guests Are Actually Ordering
Tenzo pulls your POS data in near real-time, giving you item-level sales breakdowns across any time period — last week, last month, last quarter, or year-on-year. You can see which dishes are driving covers, which dayparts are strongest for different categories, and how your menu mix is trending over time.
This means your popularity data isn't a guess — it's a rolling, accurate picture of what your guests are choosing. Because Tenzo surfaces this in intuitive dashboards accessible from any device, you don't need to run a report or pull an export to get the insight.
Food Cost Data: Knowing Your True Gross Profit Per Dish
The profitability side of the matrix depends entirely on knowing your actual food cost for every dish — not an estimate, not what it was six months ago, but what it costs today given current supplier prices. That's where MarketMan does the heavy lifting.
MarketMan connects your recipes to your live inventory and purchasing data, so when a supplier increases the price of a key ingredient, your recipe costs update automatically. You can see which dishes have drifted outside your target GP%, set alerts for when a menu item crosses a cost threshold, and go into any menu engineering conversation confident that your numbers reflect reality in Tenzo.
How to Run a Menu Engineering Analysis: Step by Step
Step 1 — Define Your Analysis Period Pull your sales data for a meaningful period — typically 4 to 12 weeks. Avoid weeks with significant anomalies (a major local event, a period of refurbishment, unusual weather) unless you're specifically trying to understand seasonal performance. Tenzo makes it easy to select custom date ranges and compare periods side by side.
Step 2 — Calculate Gross Profit Per Dish For each item: selling price (net of VAT) minus food cost. Use your MarketMan recipe costs — not estimates. Don't rely on GP% alone; a dish with a 70% GP% on a £6 item generates less actual profit than one with a 60% GP% on a £14 item.
Step 3 — Calculate Mix Percentage (Popularity) Divide the number of portions sold of each item by the total portions sold across that category. Any dish performing above the average is 'popular'; below average is 'unpopular'.
Step 4 — Plot the Matrix With GP per dish and mix percentage calculated, classify each item into the four quadrants. Look for patterns — clusters of Dogs to cut, Puzzles to promote, Plowhorses to engineer.
Step 5 — Act, Then Measure and Make Changes — adjust positioning, update descriptions, remove a Dog, reprice a Plowhorse — then track the impact. Tenzo's before-and-after comparison capability lets you compare menu mix and average transaction value before and after a change to see whether it moved the needle. Set this as a recurring task, whether that’s quarterly or yearly, ensure menu engineering becomes part of your operations and is continuously optimised.
Beyond the Basics: Advanced Menu Engineering for Serious Operators
Daypart Analysis A dish can perform very differently at lunch versus dinner, or on a Tuesday versus a Saturday. Running your analysis by daypart can reveal that a dish is a Star at dinner but a Dog at lunch, prompting you to make it dinner-only and simplify your daytime kitchen operation.
Category-Level Engineering Don't just analyse individual dishes in isolation. Look at how entire categories — starters, mains, desserts, drinks — are performing. If your dessert category has a low mix percentage overall, that's a category-level problem (perhaps your servers aren't selling them, or the menu positioning is weak) that no amount of individual dish tweaking will solve.
Beverage and Add-On Optimisation Drinks and add-ons are often the highest-margin items on any menu, yet they're frequently underengineered. Apply the Stars/Plowhorses/Puzzles/Dogs framework to your beverage menu and you may find significant untapped GP in your cocktail or wine list.
Seasonal and Trend-Driven Updates Menu engineering isn't a one-time project — it's a continuous discipline. Using Tenzo's year-on-year comparison data, you can identify seasonal patterns in your menu mix and plan your refresh cycle accordingly. This also helps you manage ingredient procurement more efficiently: if you know a dish spikes in autumn, you can plan with suppliers in advance and negotiate better pricing through MarketMan.
Common Mistakes to Avoid
- Using outdated food costs. If your recipe costs haven't been updated since supplier prices last changed, your GP calculations are wrong. MarketMan's integration with live purchasing data solves this — but your recipes need to be properly built and maintained.
- Analysing too short a window. A single week of data can be misleading. Aim for at least four weeks, and sanity-check against longer trends.
- Treating the matrix as binary. A dish sitting just below the popularity average isn't necessarily a Dog. If it attracts a specific high-value customer, it may earn its place for reasons the data doesn't fully capture.
- Failing to act. The biggest mistake is running the analysis, identifying clear actions, and then not implementing them. Build menu engineering reviews into a regular calendar cadence — quarterly at minimum.
- Ignoring kitchen complexity. A dish can look good on the matrix but be operationally costly to produce. High prep time, specialist skills, or low yield can erode the GP that looks attractive on paper. Your kitchen team's input is essential.
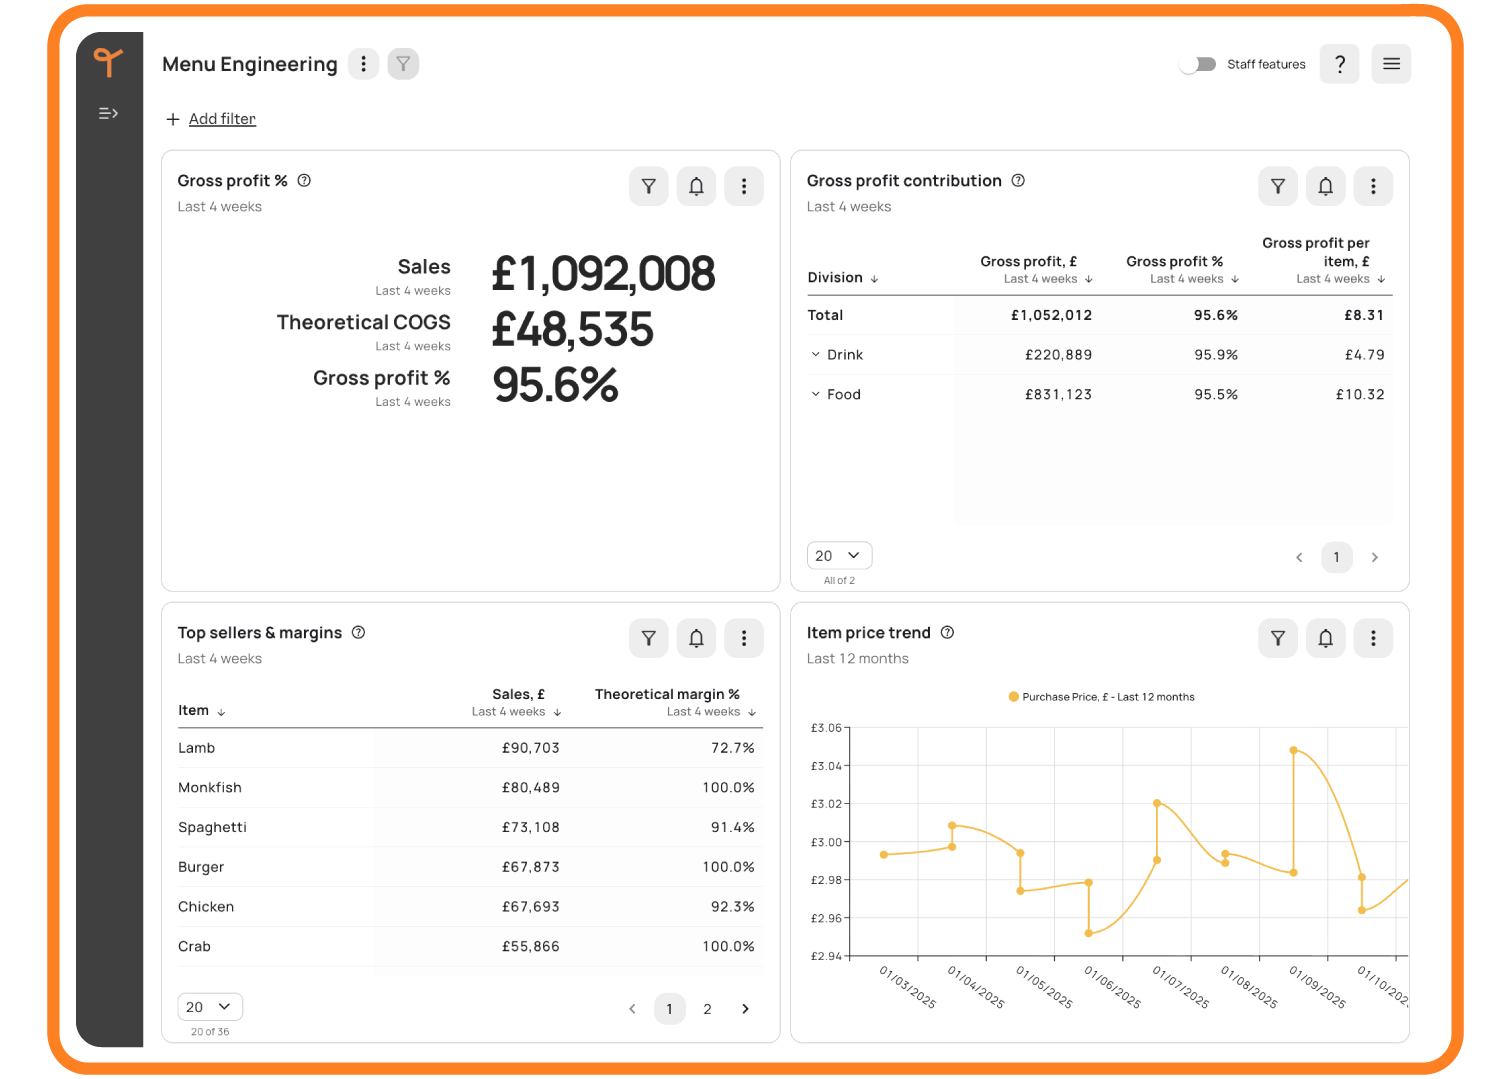
See It in Action: Automate Your Menu Engineering with Tenzo x MarketMan
Everything covered in this guide — GP calculations, mix percentages, before-and-after tracking — can now be automated through the Tenzo and MarketMan integration. Your dish-level profitability updates automatically as supplier prices change, your menu mix is tracked in real time, and demand forecasts feed directly into your inventory ordering. No spreadsheets, no manual data pulls, no quarterly scramble.
If you'd like to see how it works with your menu and your operation, book a demo with the Tenzo and MarketMan teams today.
Final Thoughts
Menu engineering has always been a sound discipline. What's changed is the quality and accessibility of the data available to support it. With Tenzo providing real-time, item-level sales intelligence and MarketMan keeping your food costs accurate and current, the analysis that once required a consultant and a spreadsheet marathon can now be part of your regular operational routine.
The restaurants that will thrive in the years ahead won't necessarily be the ones with the most creative menus or the highest-profile chefs. They'll be the ones that understand their numbers deeply, make changes quickly, and build menus that are as well-engineered as the businesses behind them.
Mitwirkende
Schließen Sie sich über 18.000 Restaurants an und erhalten Sie die heißesten Restauranttipps direkt in Ihren Posteingang.
Das könnte Sie auch interessieren


Bereit zum Start?
Sprechen Sie noch heute mit einem Restaurantexperten und erfahren Sie, wie MarketMan Ihrem Unternehmen helfen kann